Statistics on the amount of gantry cranes imported from China by U.S.A
According to the data of China Customs, from January to August 2022, the value of gantry cranes imported from China by the United States was 12.743 million US dollars, a decrease of 23.478 million US dollars, a year-on-year decrease of 64.82%
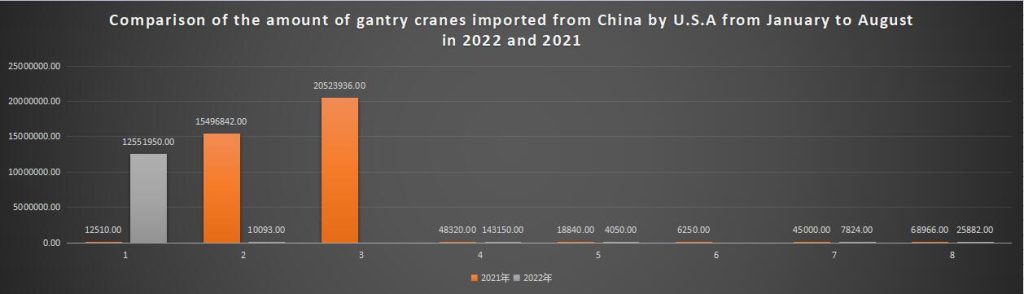
Comparison of the amount of gantry cranes imported from China by U.S.A from January to August in 2022 and 2021
Comparison of the amount of gantry cranes imported by U.S.A in eight months of 2022 and 2021
| 2021 | 2022 | |
| 1 | 12510.00 | 12551950.00 |
| 2 | 15496842.00 | 10093.00 |
| 3 | 20523936.00 | |
| 4 | 48320.00 | 143150.00 |
| 5 | 18840.00 | 4050.00 |
| 6 | 6250.00 | |
| 7 | 45000.00 | 7824.00 |
| 8 | 68966.00 | 25882.00 |
| Total | 36220664.00 | 12742949.00 |
(Unit: USD)
Statistics on the number of gantry cranes imported from China by U.S.A
According to the data of China Customs, from January to August 2022, the United States imported 39 sets of gantry cranes from China, a decrease of 392 sets over the same period in 2021, a year-on-year decrease of 90.95%
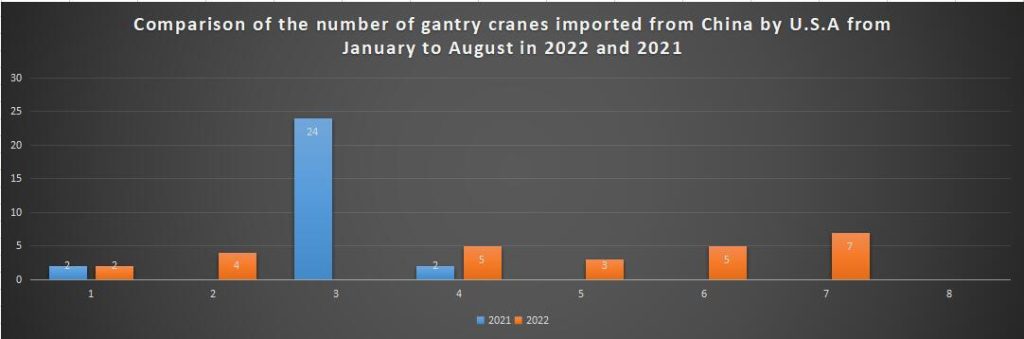
Comparison of the number of gantry cranes imported from China by U.S.A from January to August in 2022 and 2021
Comparison of quantity of gantry cranes imported by U.S.A in eight months of 2022 and 2021
| 2021 | 2022 | |
| 1 | 13 | 10 |
| 2 | 180 | 1 |
| 3 | 64 | |
| 4 | 73 | 2 |
| 5 | 30 | 1 |
| 6 | 10 | |
| 7 | 2 | 16 |
| 8 | 59 | 9 |
| Total | 431 | 39 |
How to customize crane from China
We are a crane manufacturer located in China, providing crane customization services to global crane customers. If you want to customize a crane, you can leave a message on the website or Email: sales010@cranesdq.com, tell us the following information, and our sales manager will contact you:
Data statistics of gantry cranes imported from China by U.S.A in August 2022
没有评论:
发表评论